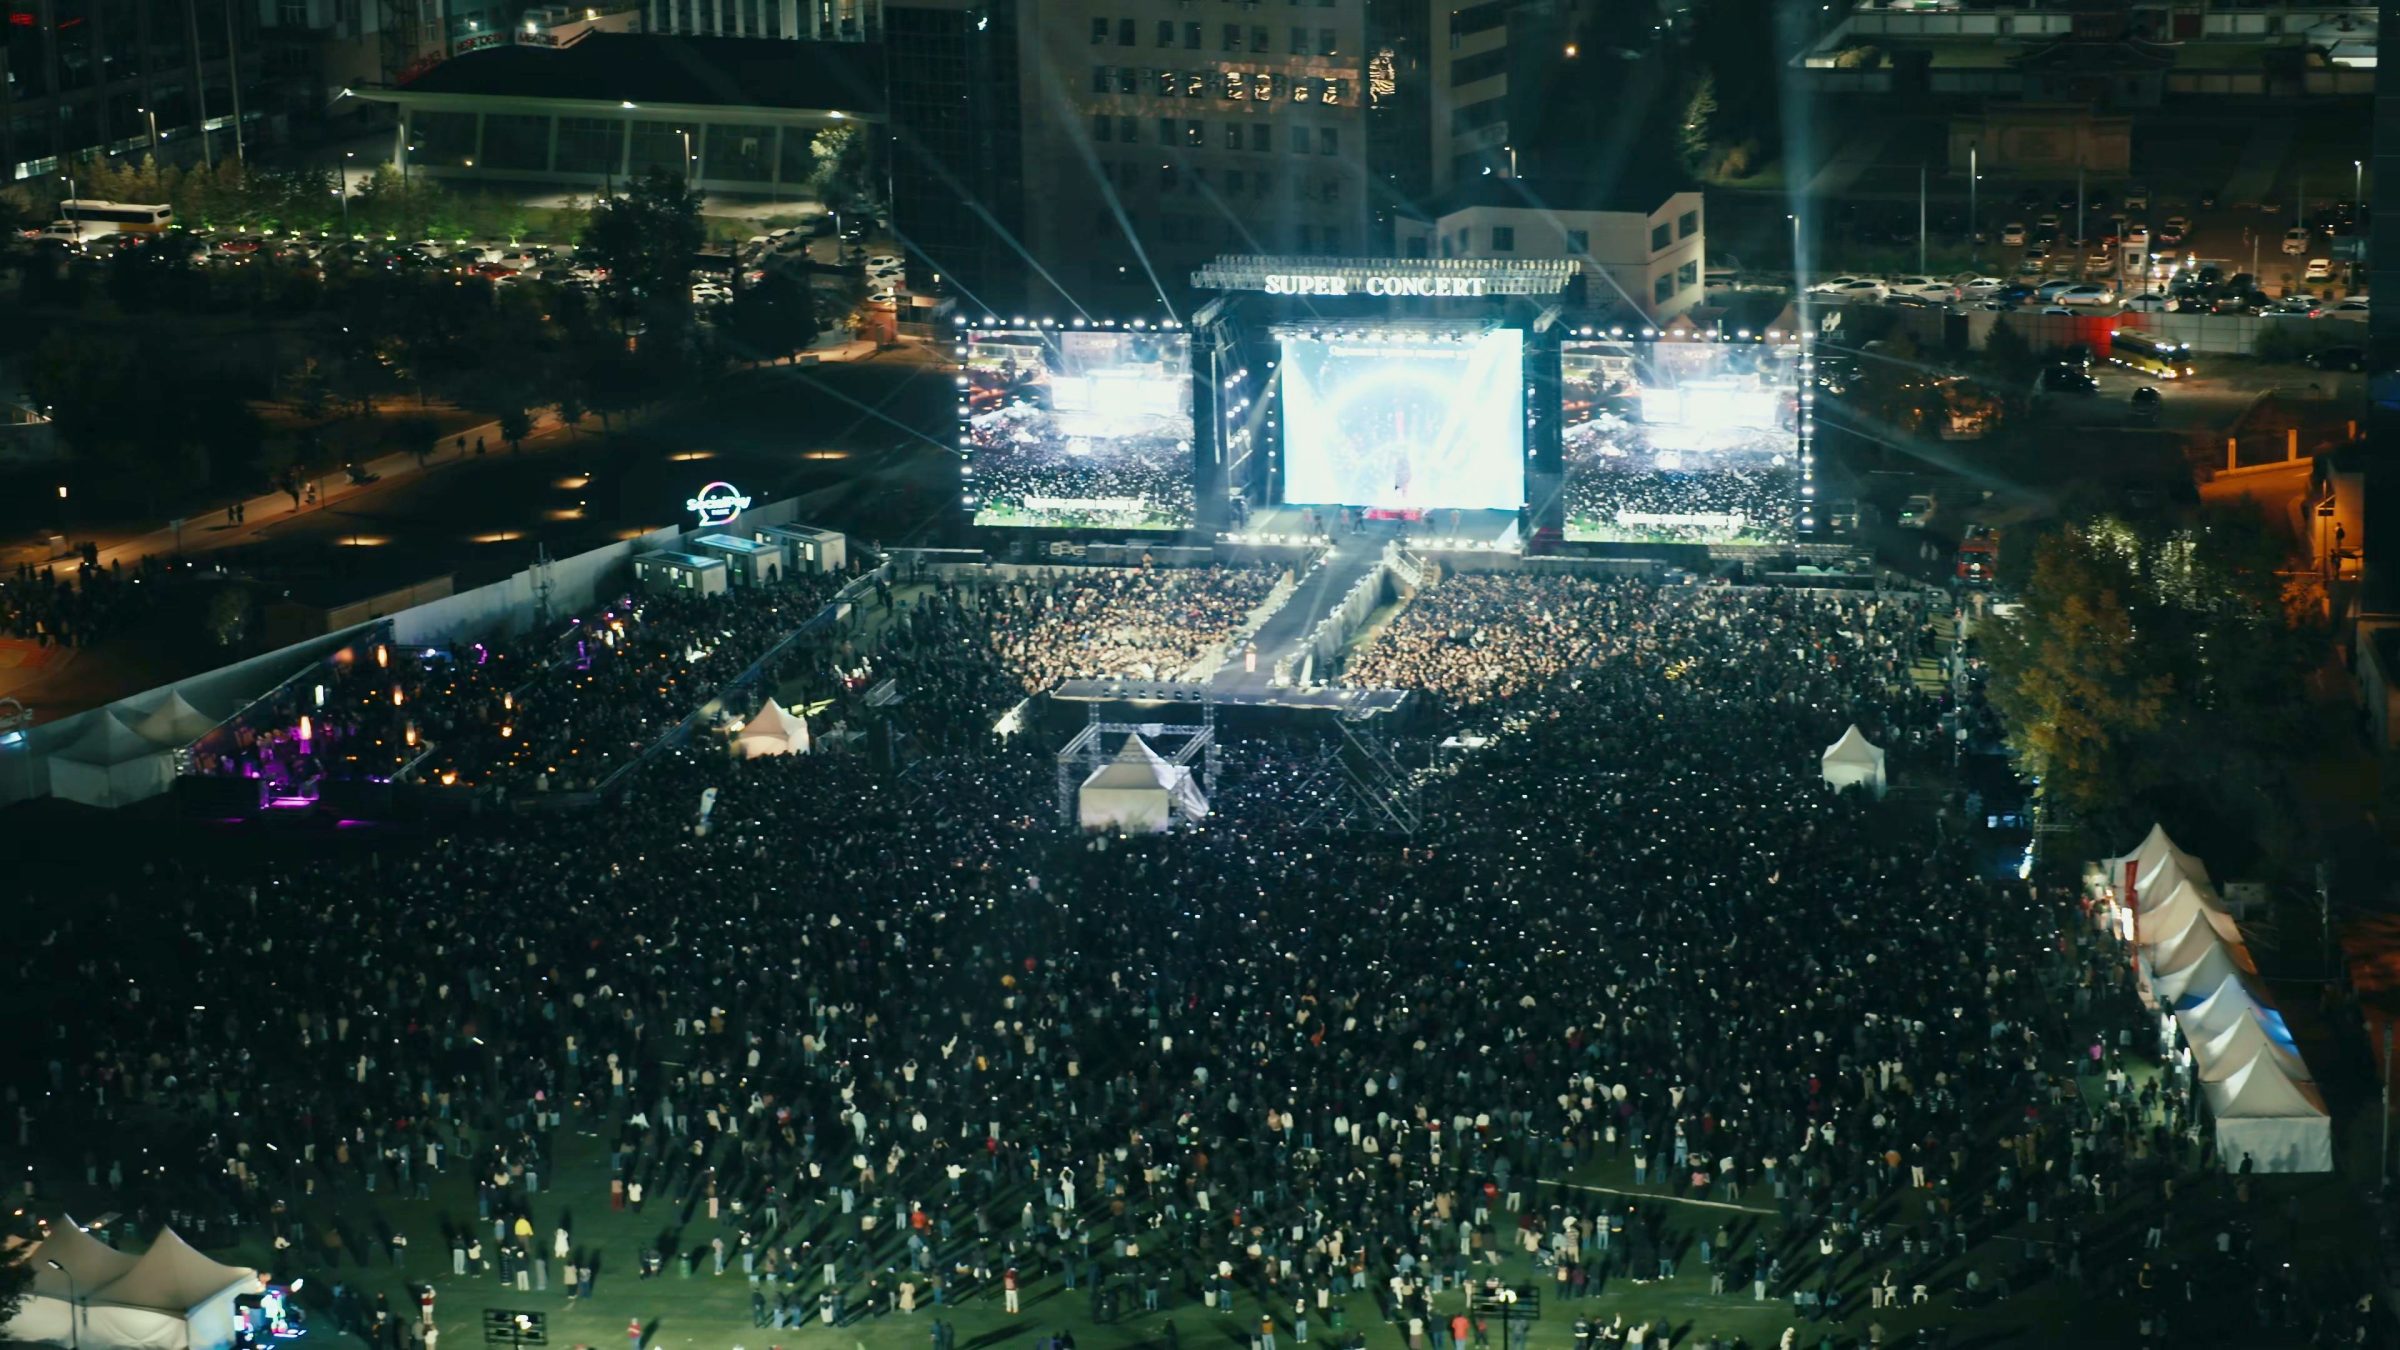
The short answer
Most likely between 14,700 and 21,900 (80% range).
Why we believe it
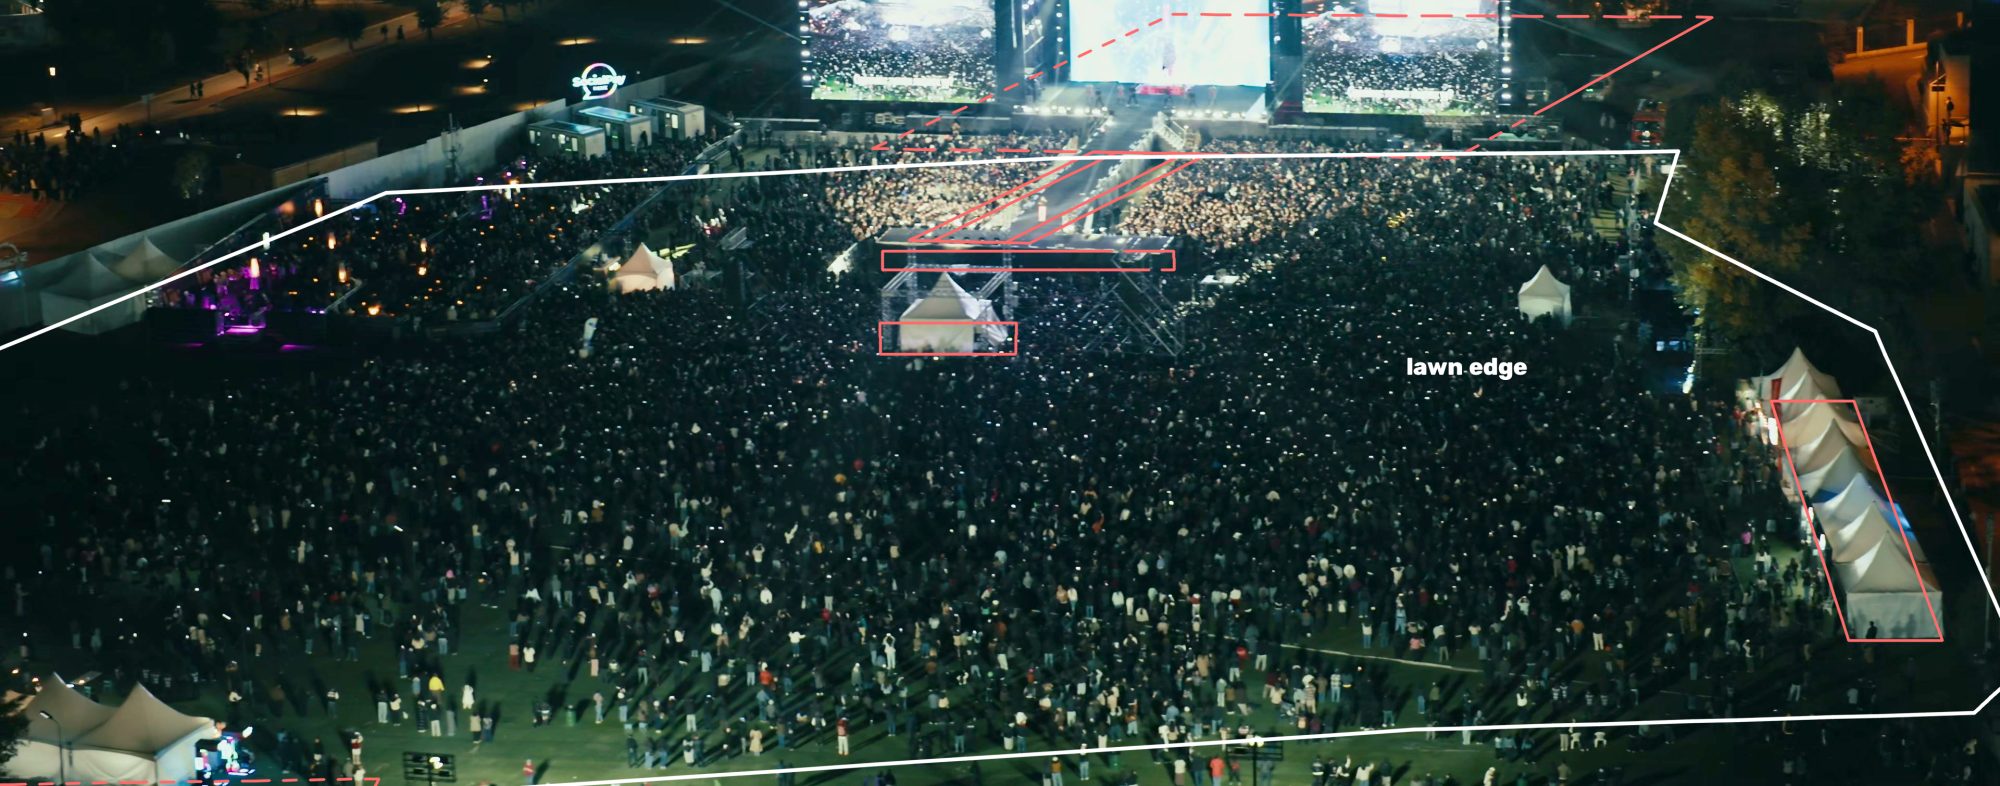
- The lawn size is measured, not guessed. We traced it on two satellite images and on the video: about 15,200 m². About 13,900 m² of it could hold a standing crowd.
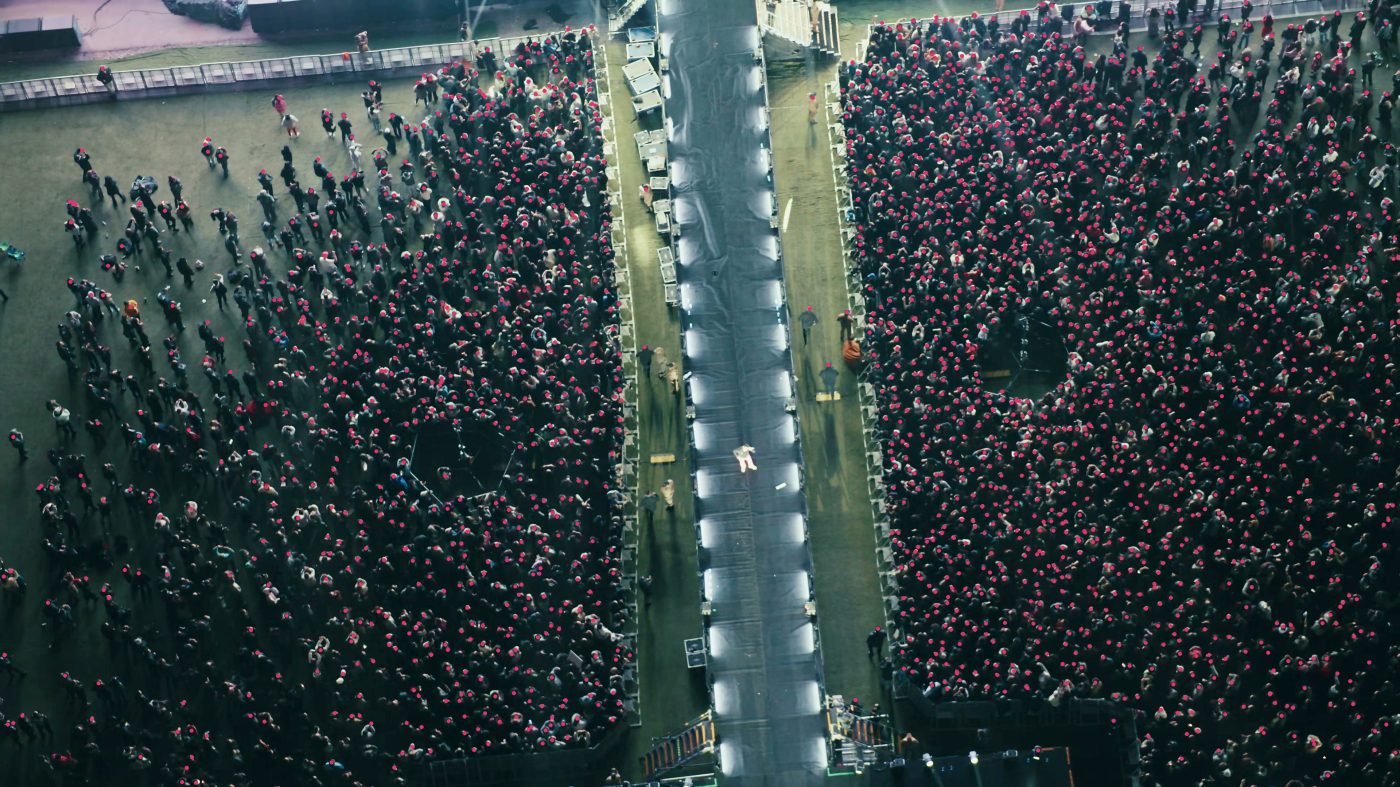
- The crowd density is measured where the video is clear. In a straight-down shot of the front pens we checked 572 heads one by one, then measured the whole pens: 3.3 people per m².
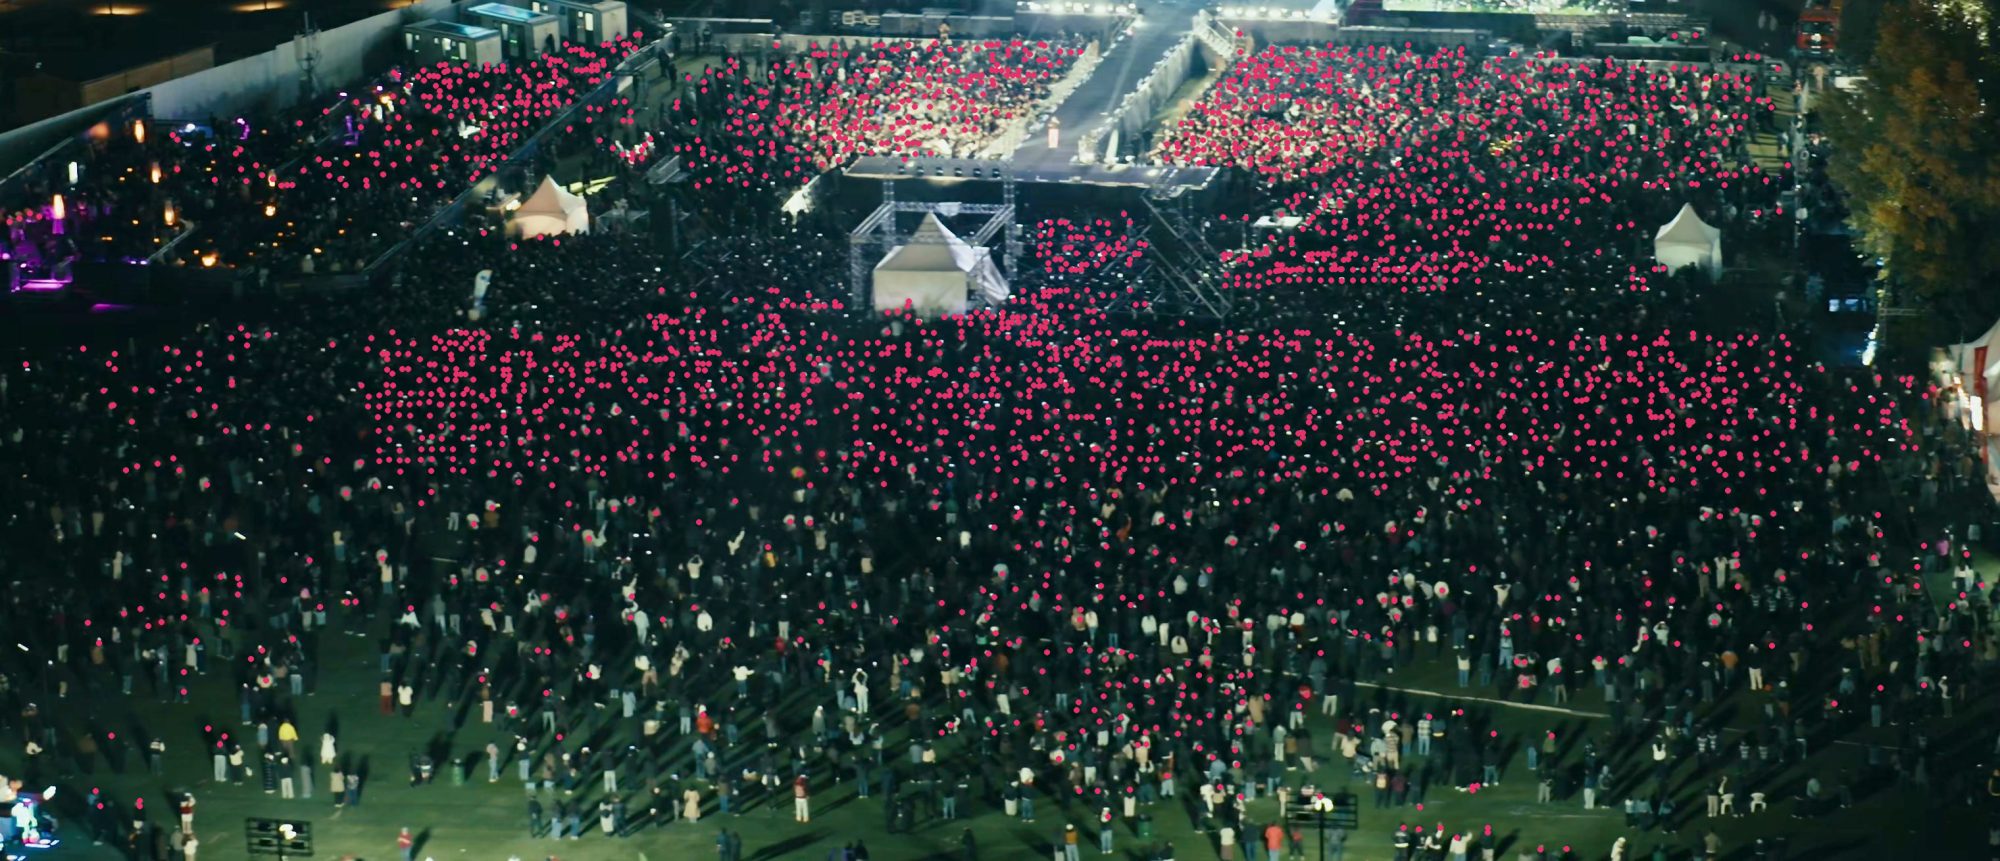
- The wide shot shows where the crowd is. An AI counter marks the heads it can see. We use those marks for the shape of the crowd and the measured densities for its size.
What this number is not. It is the crowd standing on the lawn at one moment. It does not include people in the VIP stands, at the bars and toilets, in queues, or people who came and left at other times. Total attendance for the evening is therefore higher than this number.
What we had to work with
We received one video: the organizer's edited 4K drone promo, 4 minutes 8 seconds long. We did not have the raw drone files, the flight data, ticket counts or gate scans. This report is based only on what the video and public satellite images show.
That matters for two reasons. First, a promo is edited: shots are short, the camera moves, and most shots are at night. Second, without flight data we had to work out the camera's height and angle ourselves, from objects of known position such as the stage, the runway and the lawn edges.
We used 44 still frames and three continuous sequences, 242 frames in total. Six of them carry the result:
| Video time | What it shows | What we used it for |
|---|---|---|
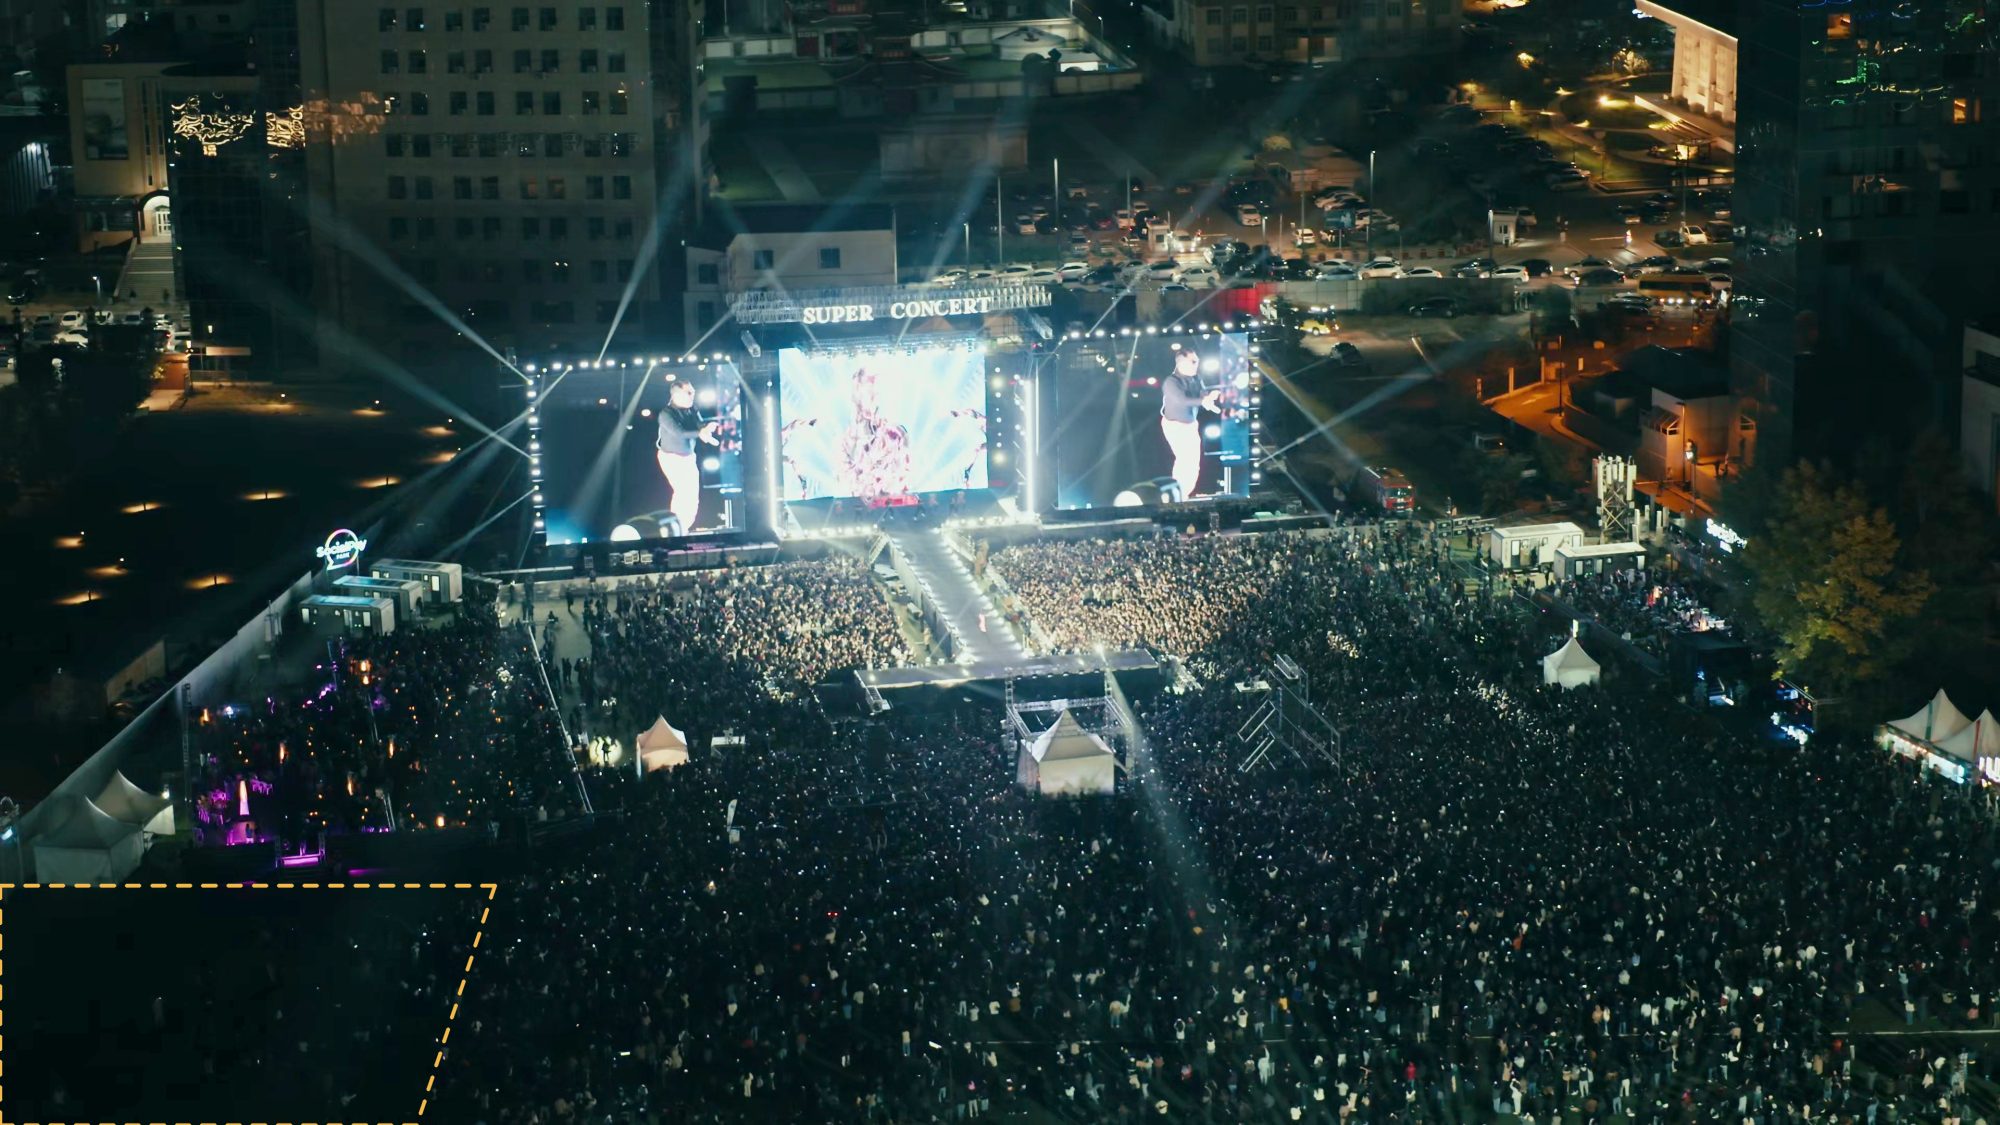
| 0:20 | The whole lawn from the south, at night | Where the crowd is |
| 1:41 | Straight down onto the two front pens | Measured density, zone A |
| 0:42 | Steep, well-lit view behind the T-shaped stage extension | Measured density, zone D |
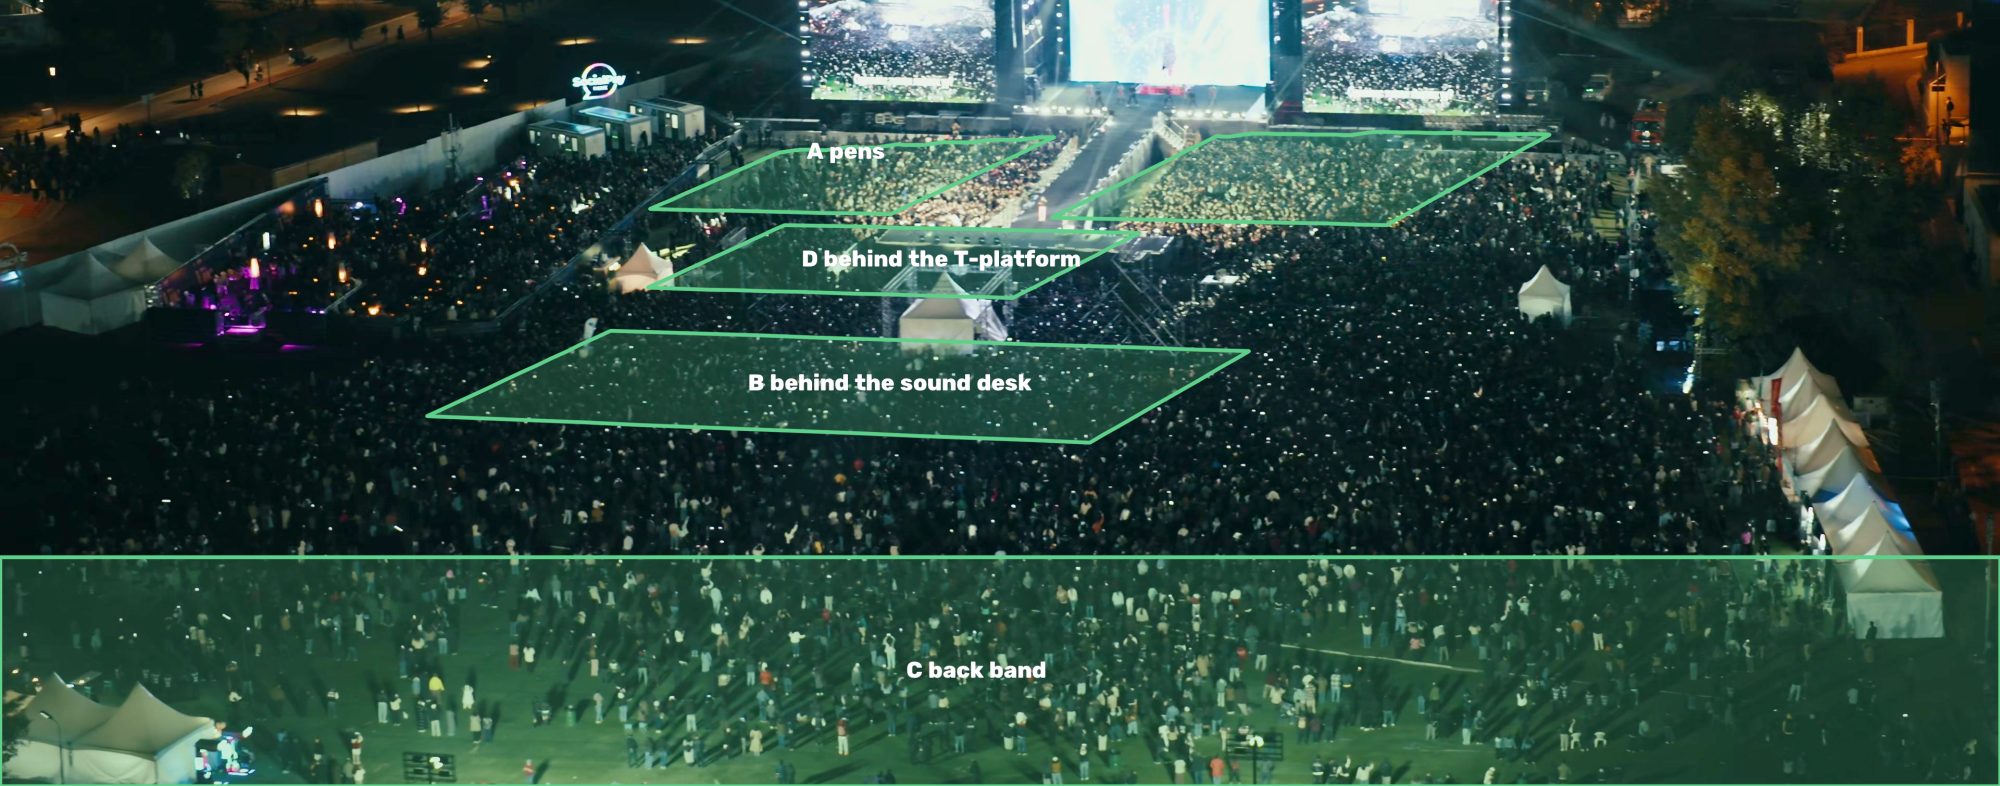
| 2:52 and 2:56 | Close, low views of the crowd around the sound desk | Estimated density, zone B |
| 0:27.5 | The whole field from the south-west | Found a near-empty strip on the west side |
Why you cannot simply count the picture
The obvious approach is to point an AI people-counter at the widest shot and read off the number. We did that with eight different counters. They found between 400 and 3,000 people. The reason is simple: at night, from 150 metres away, most heads are a few dark pixels. The counter only finds the heads that catch light.
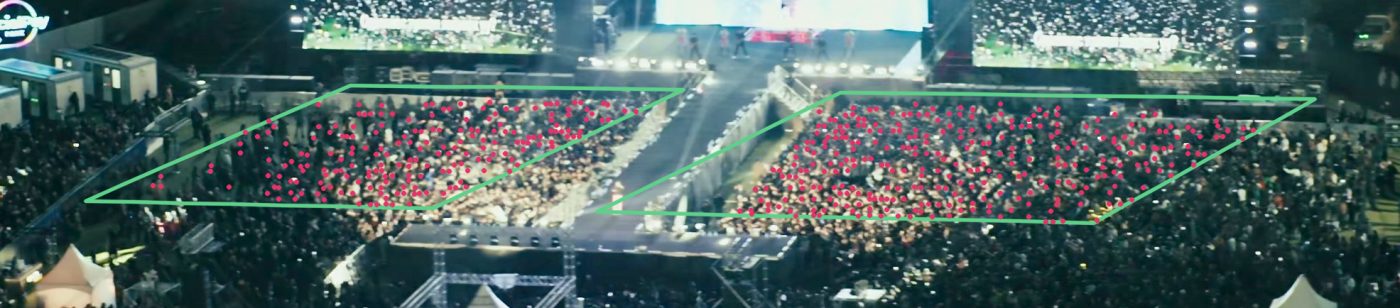
The clearest proof is the front pens. The video shows them twice: close, straight down at 1:41, and far away in the wide shot at 0:20.
How we counted, in four steps
The method is the one used for large crowds in general: measure the area, measure the density in sample places, and multiply. The AI marks decide how the density changes from place to place.
Measure the lawn
We traced the lawn edge on two independent satellite images and matched it to the video. The lawn is about 15,200 m², roughly two football pitches. We then removed the areas where nobody can stand: the stage, the runway, the T-shaped extension, the sound desk and the tents. That leaves about 13,900 m² for the crowd.
Measure the density in sample zones
Density means people per square metre. We measured it in the places where the video gives a clear view, and call those places reference zones.
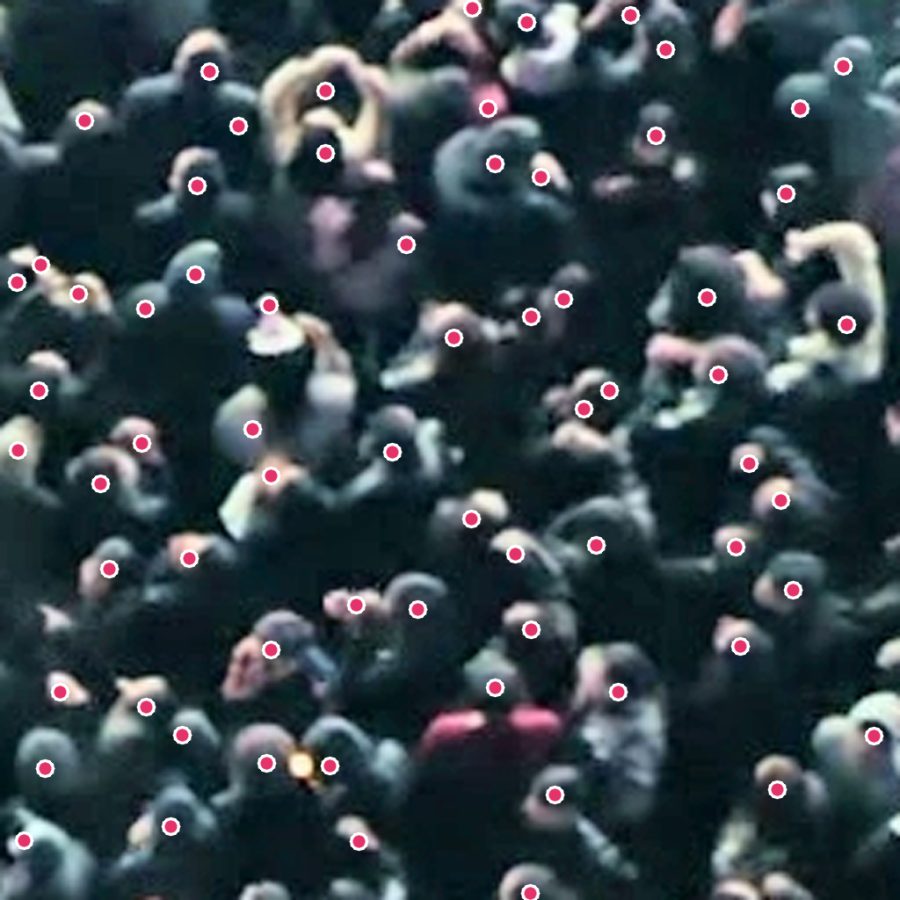
Zone A, the front pens. The straight-down shot at 1:41 is the clearest view in the video. We placed 15 boxes on a regular grid over both pens, so we could not pick only the busy spots. In each box, three AI counters marked the heads, and we then checked every mark by eye, removing doubles and adding missed heads. The 15 boxes held 572 people, and the AI counters had found 68 to 75% of them. Applying that rate to all the heads they found in the whole frame gives about 3,200 people in the part of the pens this shot covers.
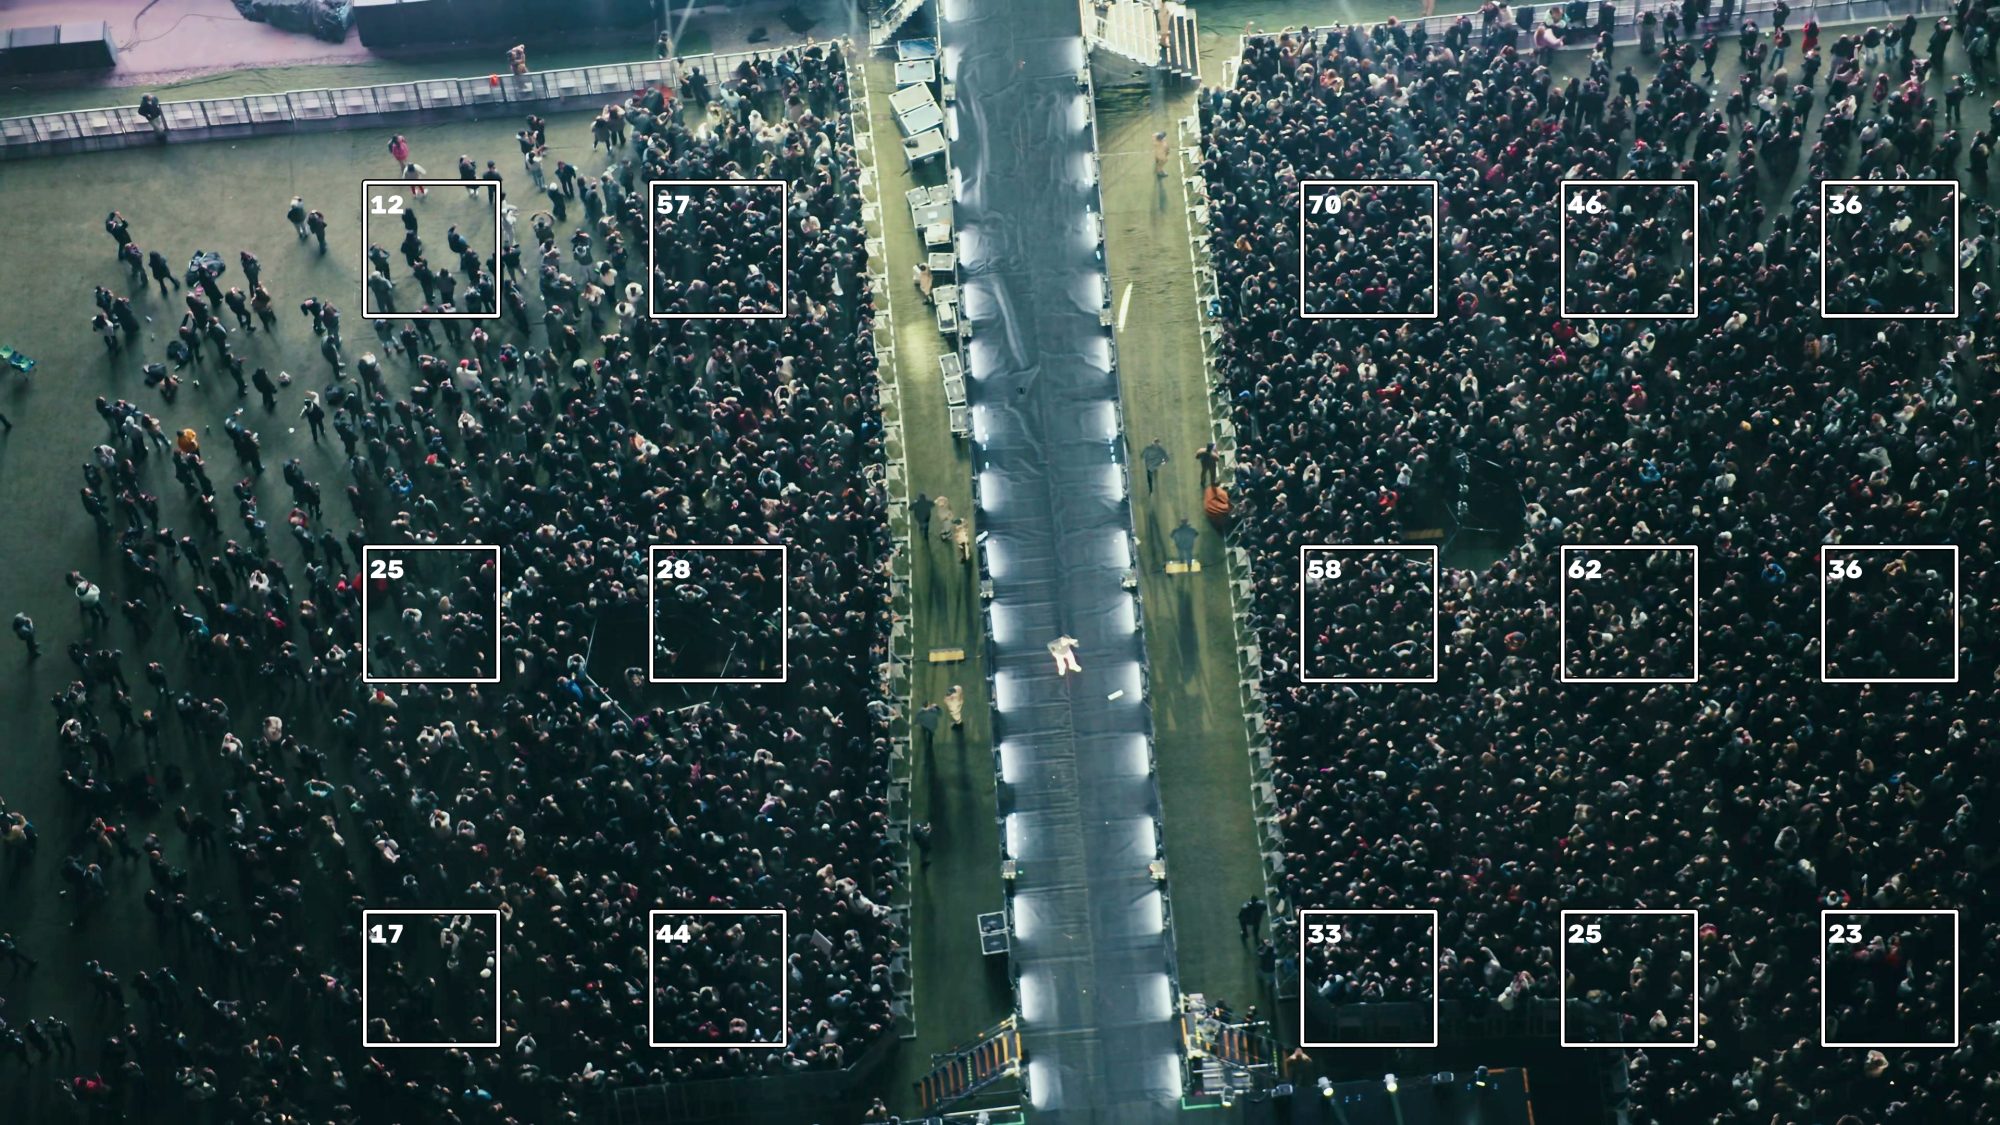
To turn a count into a density we need the size of the picture in metres. Three measurements agree: the runway's width compared with its known length (about 3.3 m wide), the gap between the pen fences, and the size of adult heads and shoulders. They give 74 to 90 pixels per metre. The result is 3.3 people per m², between 2.7 and 4.1 across that range. That is packed, as expected at the front of a sold-out K-pop show.
An earlier draft of this report used 60 to 70 pixels per metre, taken from equipment cases whose true size we did not know, and arrived at 15,200 people. The independent reviewer measured the runway differently and flagged the difference. We checked it, and the runway and body-size measurements agree with the reviewer.
Zone D, behind the T-shaped extension. The shots from 0:30 to 0:44 look steeply down on this zone in good light. On 30 frames we compared the head density here with the front pens: it is 0.84 times the pen density, between 0.72 and 0.93. That gives 1.9 to 3.8 people per m². This ratio was measured on an angled view, so it is less certain than the pen density; it is the largest single source of doubt in the result.
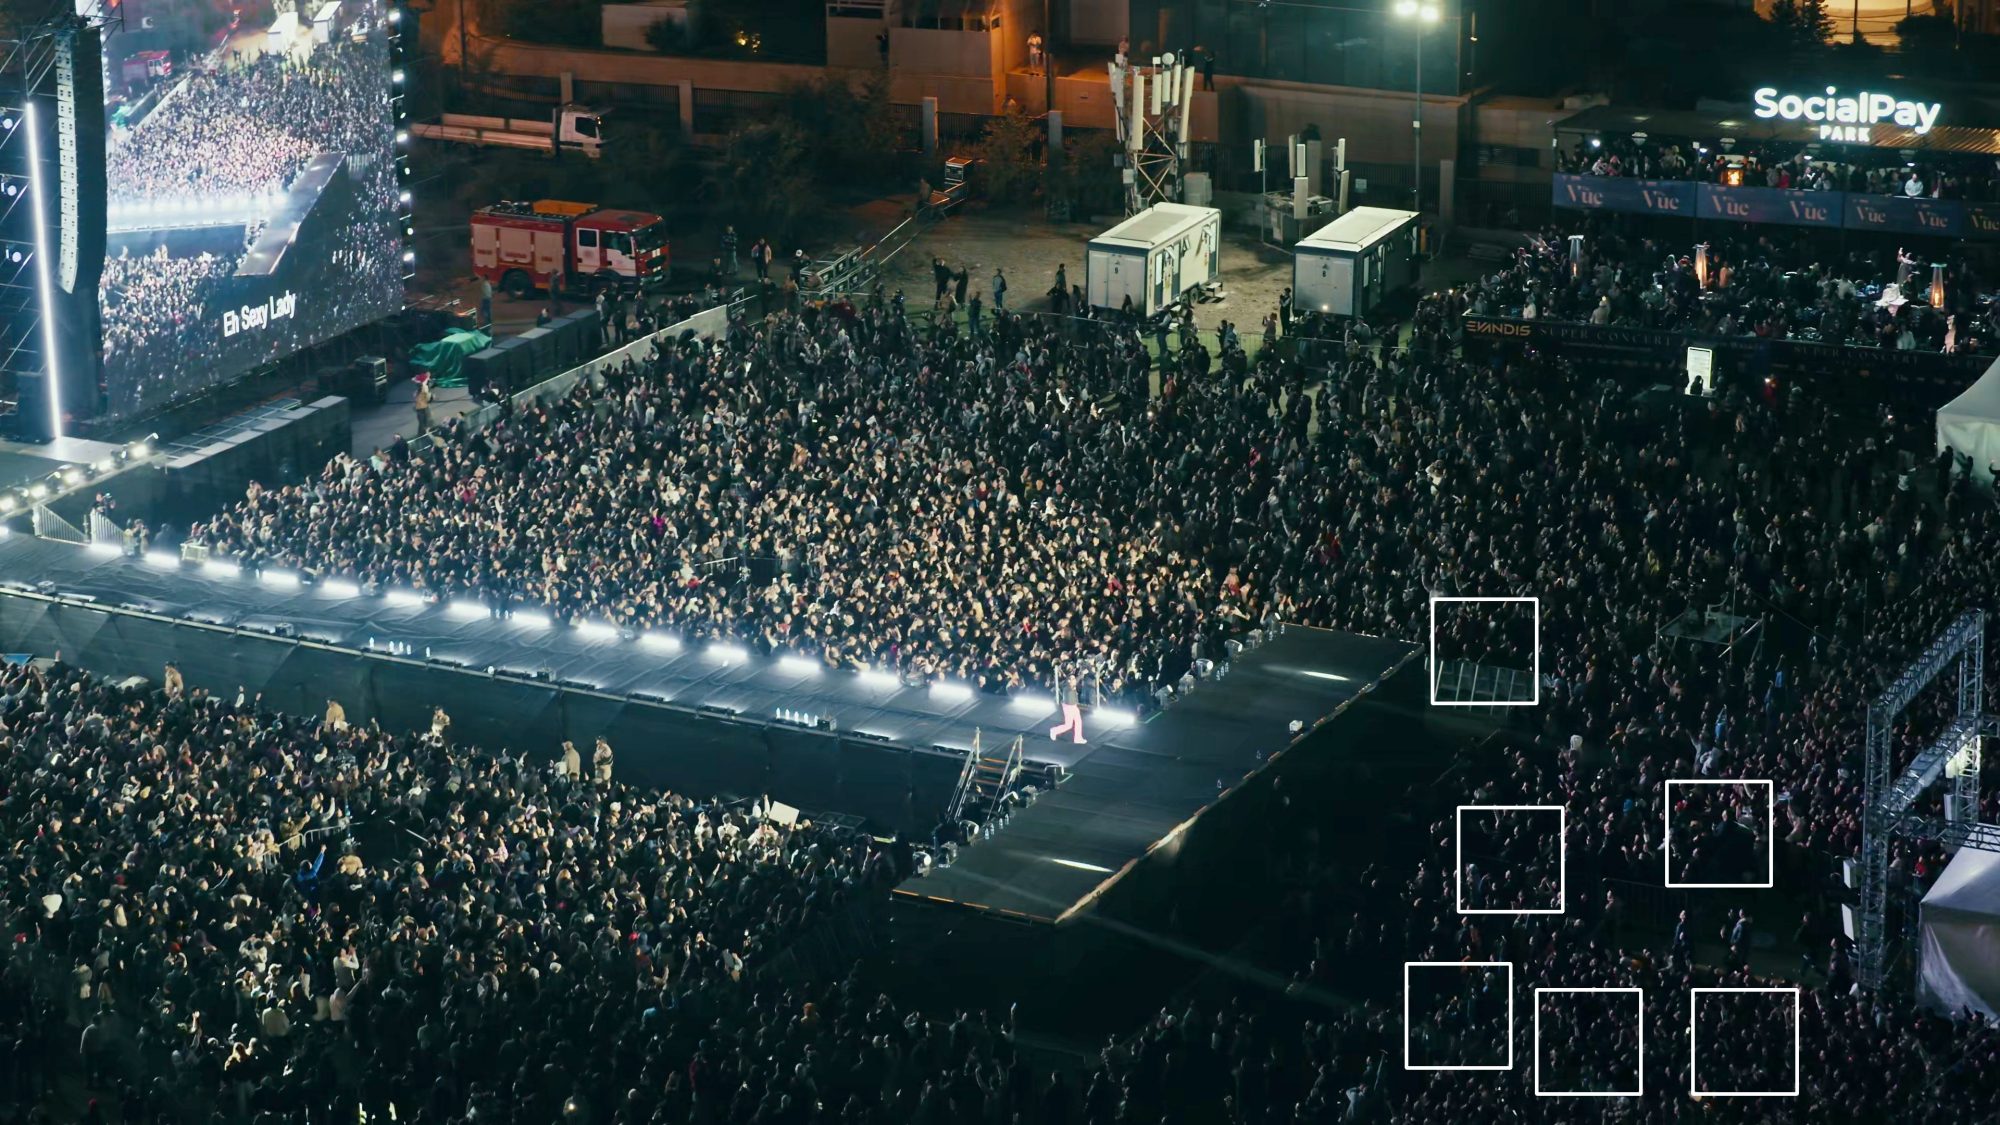
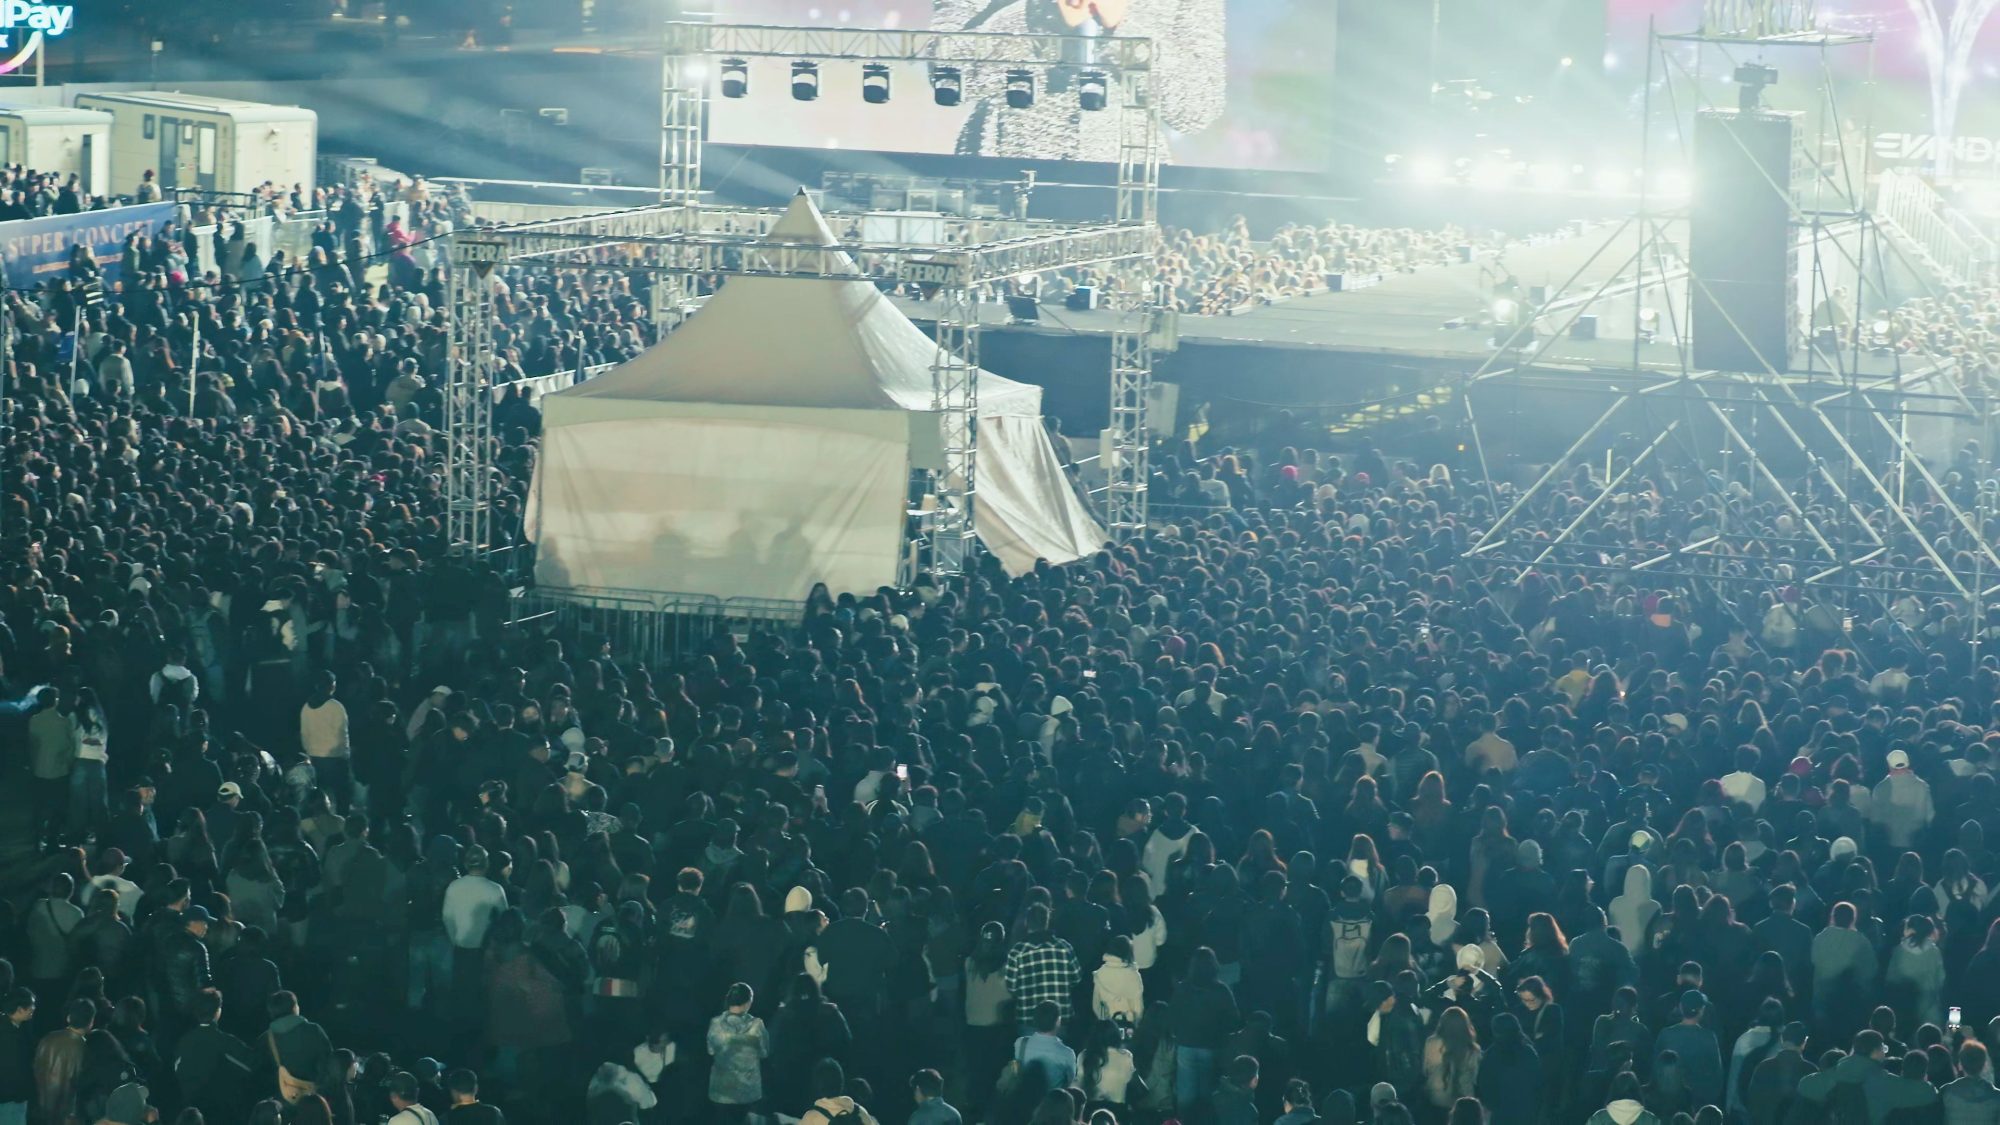
Zone B, behind the sound desk. This is the weakest input. No shot looks down on this zone. The close shots at 2:52 and 2:56 are low and angled, so people hide each other. We judged the density at 1.5 to 2.5 people per m² by eye. We say more about this below.
Zone C, the back of the field. Here the crowd is thin and people stand apart, so the AI counters find most of them. We checked their count by hand in sample patches: 360 to 900 people in the back band.
See where the crowd is
In the wide shot at 0:20 the AI counters mark every head they can find. Most heads are missed, but the marks still show the pattern: where the crowd is packed, where it thins out, and where the ground is empty. We averaged 25 frames around 0:20 and used three different counters, so no single frame or counter decides the result.
The video also caught one thing the dots alone would miss. At 0:27.5, a strip along the west fence, south of the VIP lounge, is almost empty. We capped the density there at 0.1 to 0.5 people per m².
Scale up and add up
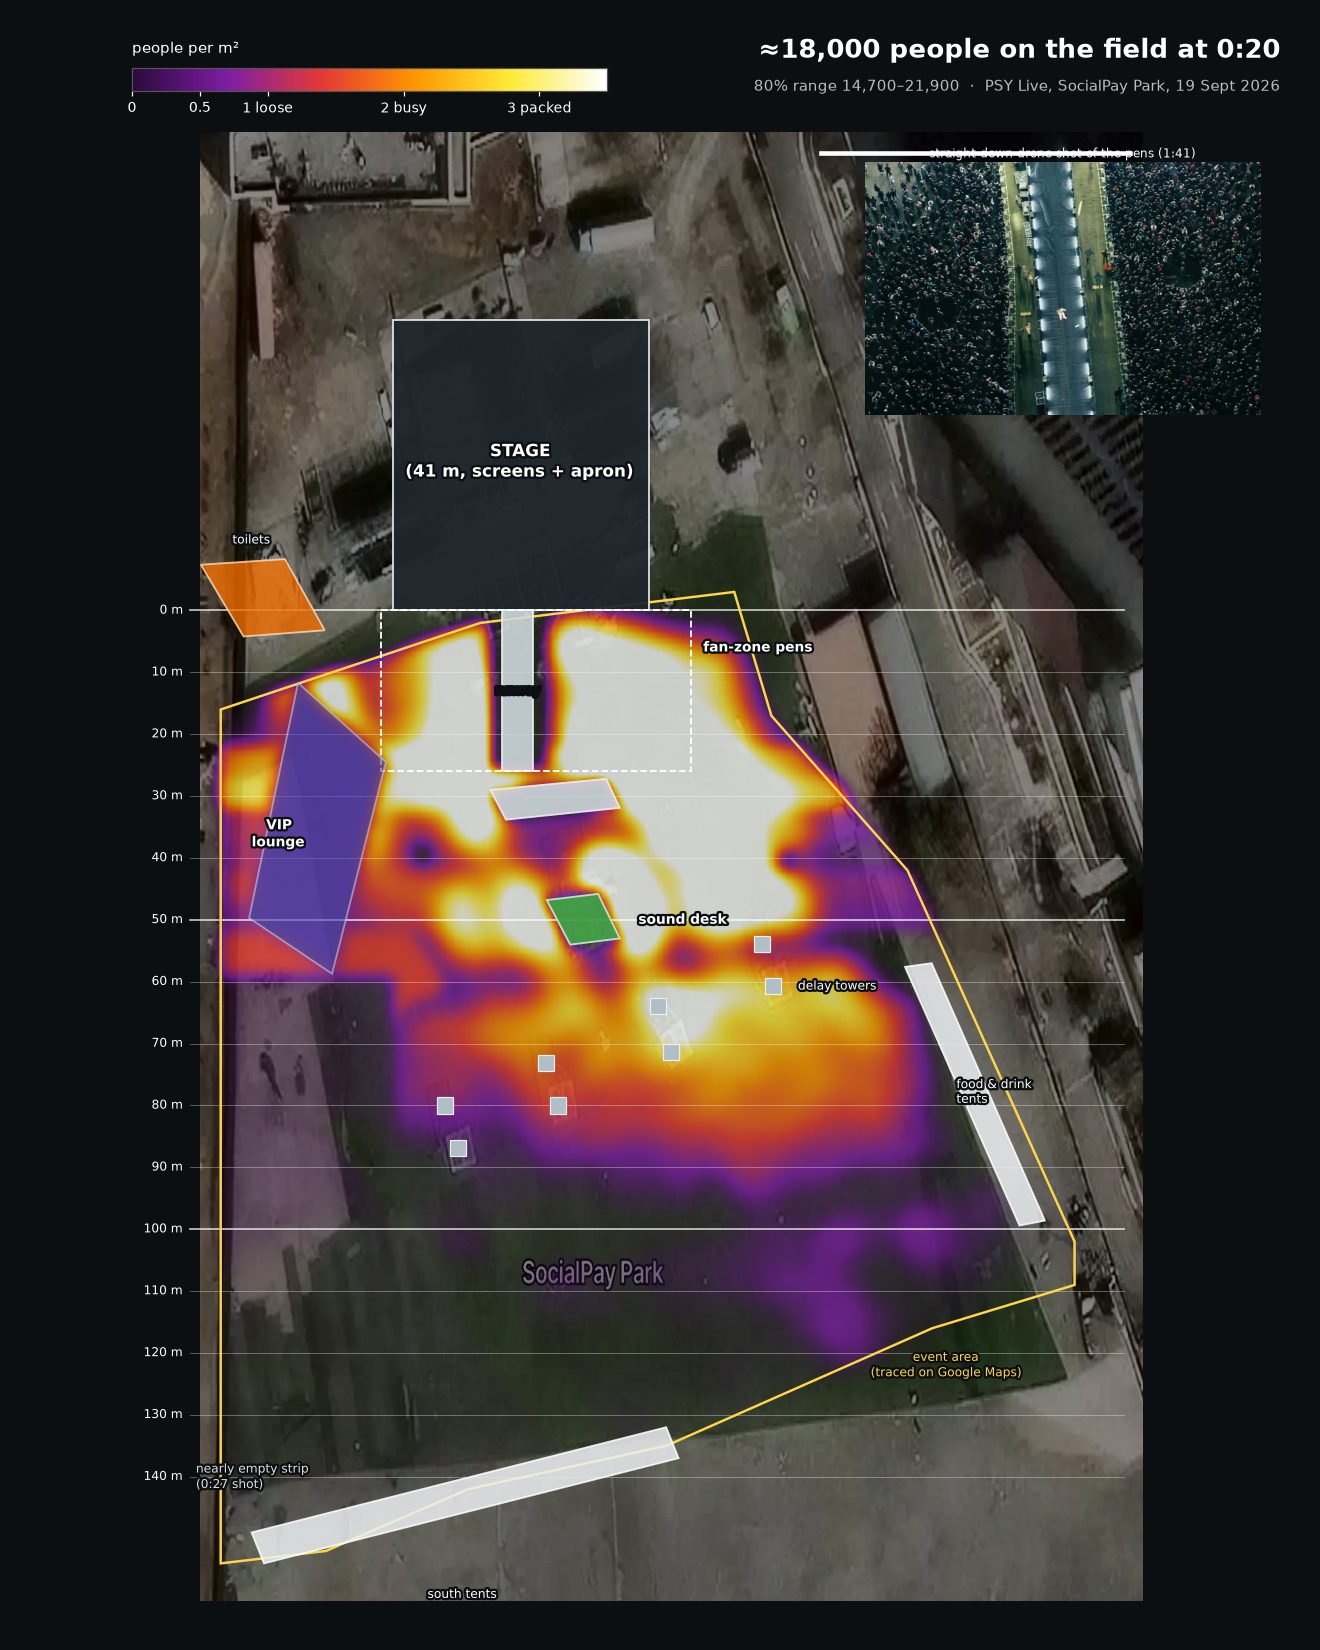
We place every AI mark on a ground map of the lawn, using the camera position we worked out. Then, in each reference zone, we compare the marks with the measured density. In the pens, for example, there are about seven people for every head the AI marked. Far behind the stage extension, where it is dark, there are twenty or more.
These correction factors are blended smoothly with distance from the stage and applied to every mark. The result is a density map of the whole lawn. We then fill the parts of the lawn outside the frame from their neighbours, add the VIP lounge at a low density, and apply the cap on the empty west strip.
From 2,300 heads seen to 18,000 people
This chart shows how the number is built. It starts with the heads the AI actually found in the wide shot and adds each step in turn.
| Step | People |
|---|---|
| Heads the AI saw at 0:20 (average of three counters) | 2,314 |
| Correction to the measured densities | +14,490 |
| Dark area on the west side, filled from its neighbours | +834 |
| Parts of the lawn outside the frame | +639 |
| VIP lounge, at 0.5 to 1.2 people per m² | +514 |
| Near-empty strip along the west fence | −761 |
| People on the lawn | 18,030 |
The middle of the 100,000 re-runs described below is 18,000, which is the number we report. The large correction step is not a guess: it is the measured densities from step 2, spread over the lawn with the pattern from step 3.
How sure are we
Every input has some uncertainty: the densities, the camera position, the lawn edge, and how the factors are blended. We re-ran the whole calculation 100,000 times, each time varying every uncertain input within its own range. The results form the range below.
In plain words: the crowd was very likely between 13,900 and 23,100, most likely between 14,700 and 21,900, and our best single estimate is 18,000.
What moves the number most
Some inputs matter more than others. This chart shows how much of the uncertainty comes from each one.
Three inputs carry three quarters of the uncertainty. The densities of zones D and B decide the level in the middle of the field, which holds most of the crowd. The camera position and lawn edge decide how the wide shot maps onto the ground. Zone D rests on a ratio from an angled shot and zone B on a judgement by eye, so these are the first things we would improve with better footage.
Sense checks
Average density
18,000 people on 13,900 m² is 1.3 people per m² on average. That fits a busy, sold-out concert: packed at the front, loose at the back.The pens in two views
The same pens hold about 3,300 people when counted straight down at 1:41, and about 500 AI heads in the wide shot at 0:20. That one-in-seven ratio is what the model uses at the front of the field.The steep shots
The best frame of the steep, lit sequence from 0:30 to 0:44 shows about 3,600 heads. It covers roughly the front 40 metres of the lawn, which our map puts at about 8,000 people. Seeing under half of the heads in an angled shot, against 70% straight down, is what we would expect.A second, independent estimate
A separate reviewer built an estimate from scratch, without seeing ours: dividing the lawn into eight zones and judging each zone's density by hand. They found about 16,900 on a slightly smaller crowd area, or about 18,900 on the same area as ours, with a wide range of 10,200 to 24,900.How to check this number against your own data
This estimate is independent. It was made from the video alone, without ticket or gate data. The best test is to compare it with what the organizers recorded.
- Gate scans or wristbands by time. The number of people inside the venue around the time of the drone shot should be higher than 18,000. The difference covers the VIP stands, bars, toilets and queues.
- Total tickets or unique scans. Total attendance for the evening should be higher again, because people arrive and leave at different times. At many concerts the total is 10 to 20% above the crowd at any one moment, but we cannot measure that from this video.
- If your figure for the lawn alone is far outside 14,000 to 23,000, we would like to see it. It would point to an input we should re-examine, most likely zones D and B or the camera position.
Open the evidence viewer
Limits, and what would improve the estimate
- Zones D and B are the weak points. No shot looks straight down on the middle of the field. Zone D comes from a ratio measured on an angled shot, and zone B is judged by eye. One straight-down photo of the middle would remove about half of the uncertainty.
- The camera position is worked out, not recorded. The raw drone files contain the exact height, position and angle for every frame. They would remove the largest source of uncertainty.
- The picture scale in the pens comes from the runway, the pen fences and body sizes. The stage plans, with the exact runway width, would narrow the pen density range.
- One moment, one lawn. We counted the lawn at 0:20. We did not count the VIP stands, the areas outside the lawn, or turnover during the evening.
Appendix
Glossary
Density: people per square metre. 1 per m² is a loose crowd, 2 is busy, 3 is packed, above 4 is uncomfortable.
AI counter: software trained to find heads in photos. We used three that place a dot on each head (PET, P2PNet, APGCC) and one that estimates a count per small block of the picture (ZIP).
Reference zone: a place where we measured the density ourselves from a clear shot, used to correct the AI counters everywhere else.
Correction factor: the number of real people for each head the AI marked, measured in a reference zone.
80% range: in 80 out of 100 re-runs with the inputs varied, the result fell inside this range.
Method details
Lawn: outline traced on a Sentinel-2 image and on a Planet image from the setup week, matched to the video. Stage and runway positions confirmed on the Planet image.
Camera: position, height, angle and lens fitted to landmarks in the 0:20 frame (lawn corners, stage, runway, tents). Frames from 0:19.5 to 0:20.5 were aligned to 0:20 and their detections averaged.
Counters: run on the full 4K frames after a contrast boost, on a local GPU. On the 1:41 frame the three dot counters found 68 to 75% of the 572 checked heads. The pen density is their whole-frame count divided by that rate and by the frame's crowd area (without the runway corridor and the empty pit at the stage fence).
Picture scale at 1:41: 74 / 82 / 90 pixels per metre, from the runway width (0.12–0.13 of its 27 m length in the 1:35 frame), the gap between the pen fences (8.25 m), and adult shoulder and head sizes.
Reference densities (low / middle / high, people per m²): A 2.7 / 3.3 / 4.1; D 1.9 / 2.8 / 3.8; B 1.5 / 2.0 / 2.5; C 360 / 550 / 900 people in the back band.
Caps: no spot above 6 per m² in the pens or 4.5 elsewhere; excess is spread to neighbouring cells in the same distance band.
Uncertainty: 100,000 Monte Carlo re-runs, each input drawn from its own range; the range reported is the 10th to 90th percentile.
How the number changed during the work
We record every published draft, so the reader can see what changed and why.
| Draft | Estimate | What changed |
|---|---|---|
| 1 | 15,800 | First zone-by-zone estimate |
| 2 | 16,600 | Camera model and density map |
| 3 | 14,500 | Fixes from four reviewers |
| 4 | 12,800 | Lawn area corrected from 20,400 to 15,200 m² |
| 5 | 16,300 | Zone D measured from the unused 0:42 shot; pens hand-counted |
| 6 | 14,800 | Near-empty west strip found; 25-frame averaging |
| 7 | 15,200 | Pens recounted on a 15-box grid; picture scale taken from equipment cases |
| Final | 18,000 | Picture scale corrected from the runway, pen fences and body sizes, after the independent reviewer flagged it; pen density from the whole 1:41 frame |